In October I applied for DevOps Engineering Program at Insight Fellows. The program offers an intensive 7 week full-time training designed to help engineers transition into the field of DevOps engineering. I somehow went through the first screening process and was invited to participate in the monitoring challenge.
https://github.com/InsightDataScience/Monitoring-Challenge
There are many ways to complete the tasks. Here is how I solve the challenge:
Setting up 3 t2.micro AWS EC2 instances
The challenge requires 3 EC2 instances. First, I start by creating one EC2 instance, I name it Instance-0, using Amazon Machine Image (AMI) with t2.micro size in EC2 Dashboard. In this process, an SSH key needs to be selected in order to log into the instance as well as a security group for networking access.
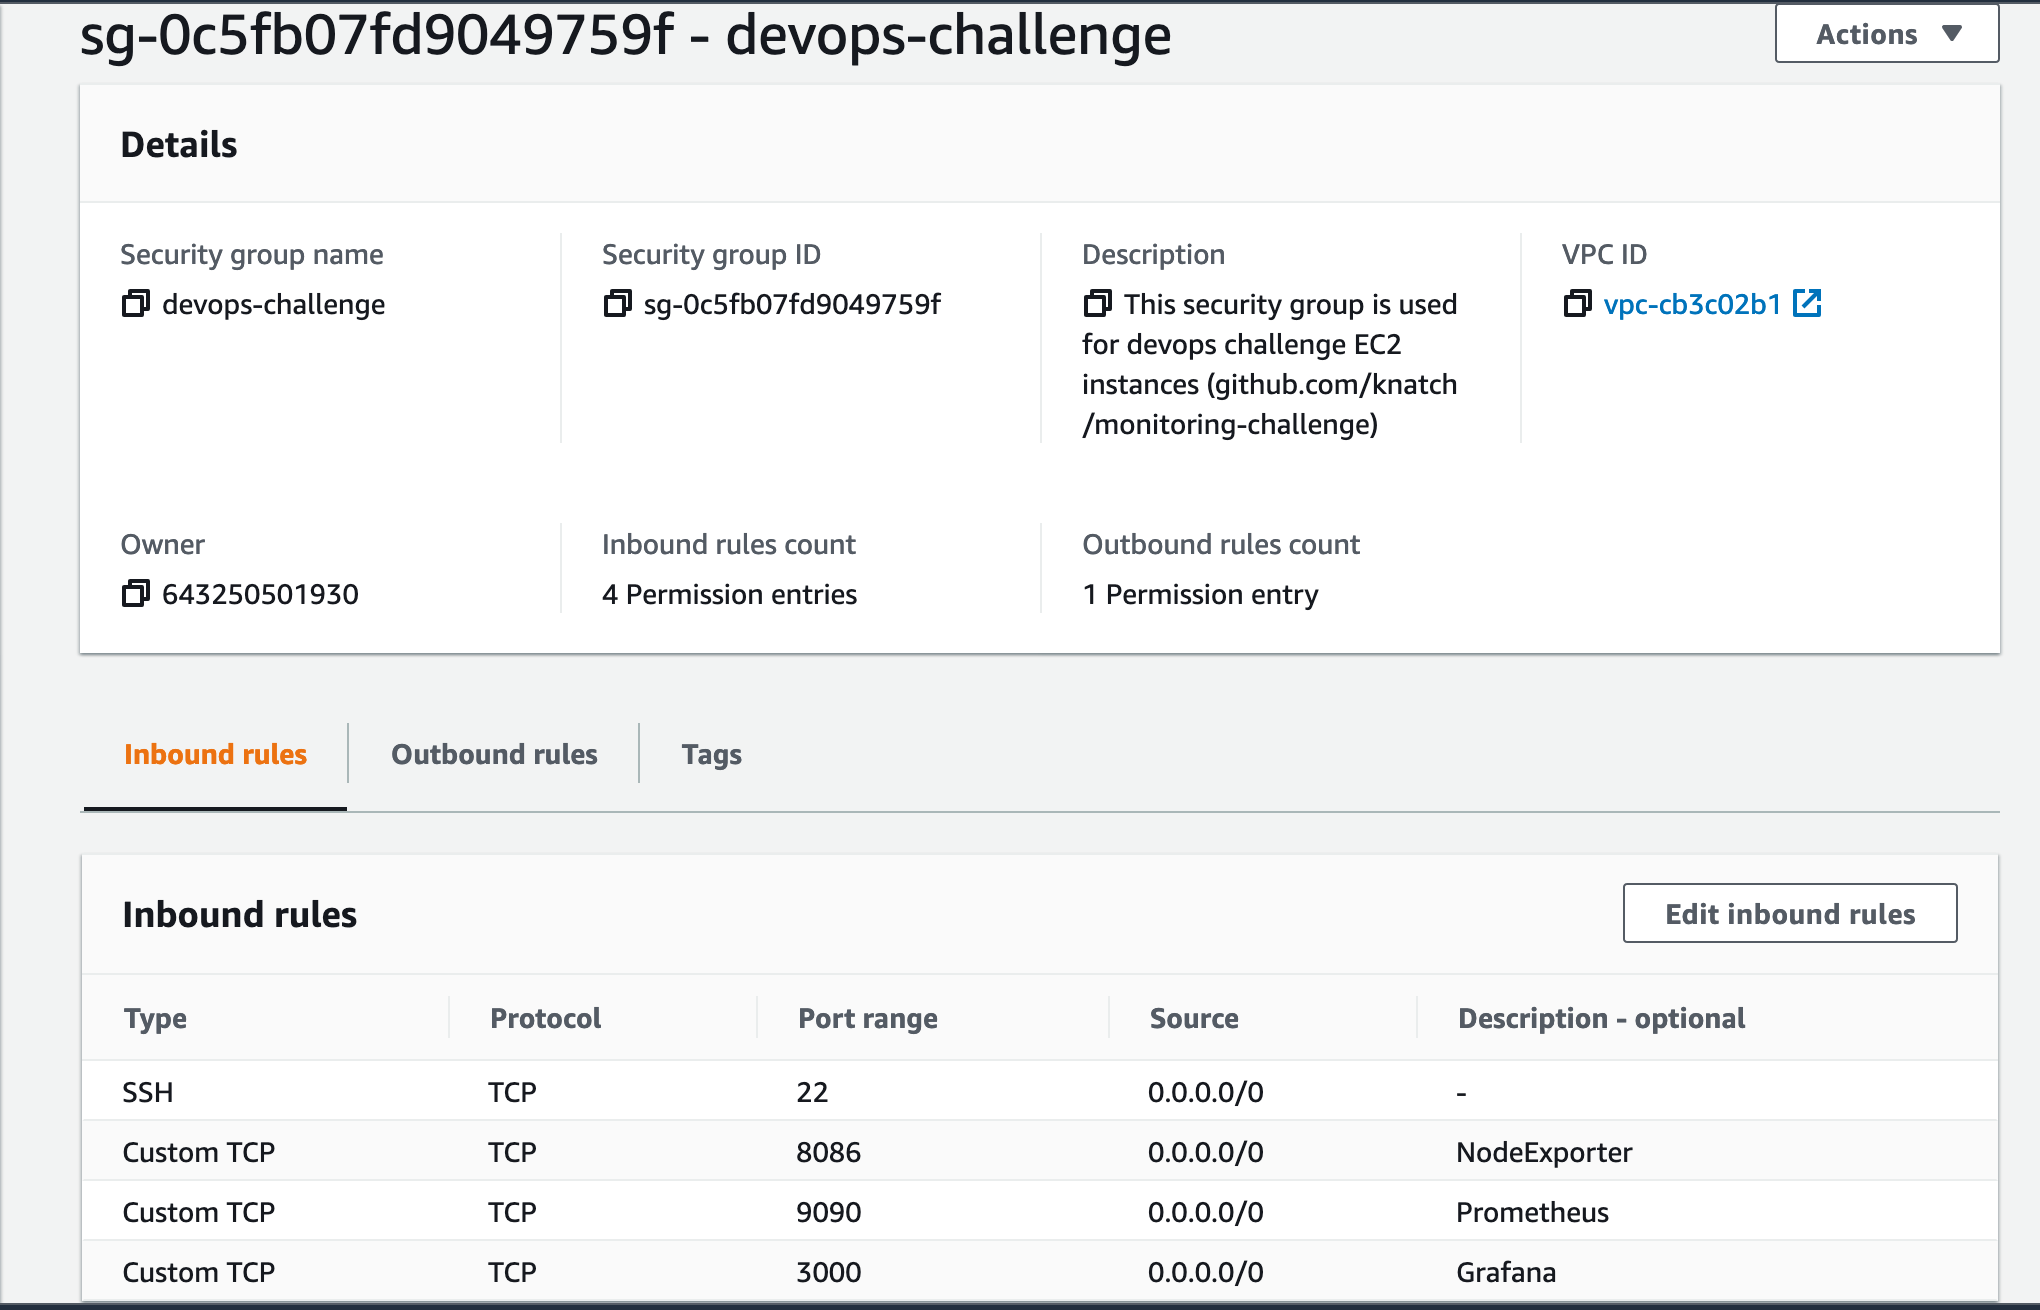
The default security group only allows port 22 for SSH access inbound rule. I change the group name and configure more inbound rules to allow the necessary processes.
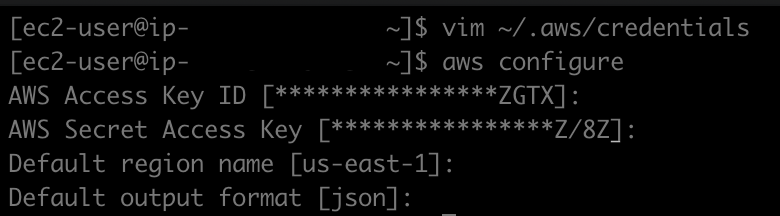
Using the Instance-0's Public IPv4 address and the specified SSH key, in a local machine terminal, I am now able to SSH into the instance. Next, I configure the AWS CLI to manage AWS services by pasting AWS credentials into Instance-0 ~/.aws/credentials file and run aws configure.
AWS Command Line Interface (CLI) is a unified tool to manage AWS services. AWS CLI provides control over multiple AWS services from the command line and automate them through scripts which is beneficial in this task. As I need to create another 2 EC2 instances that I am going to be monitored on, the command I am going to run is aws ec2 run-instances. Before that, I paste a file into Instance-0. This file contains commands that will install required dependencies when a Linux instance launches. The file's name is launch.sh.
# launch.sh content
#!/bin/bash
yum update -y
yum install -y docker git
curl -L "https://github.com/docker/compose/releases/download/1.27.4/docker-compose-$(uname -s)-$(uname -m)" -o /usr/local/bin/docker-compose
chmod +x /usr/local/bin/docker-compose
ln -s /usr/local/bin/docker-compose /usr/bin/docker-compose
usermod -aG docker ec2-user
service docker start
git clone https://github.com/knatch/dockprom /home/ec2-user/dockprom
chown ec2-user -r dockprom/
cd /home/ec2-user/dockprom
ADMIN_USER=admin ADMIN_PASSWORD=admin docker-compose up -d
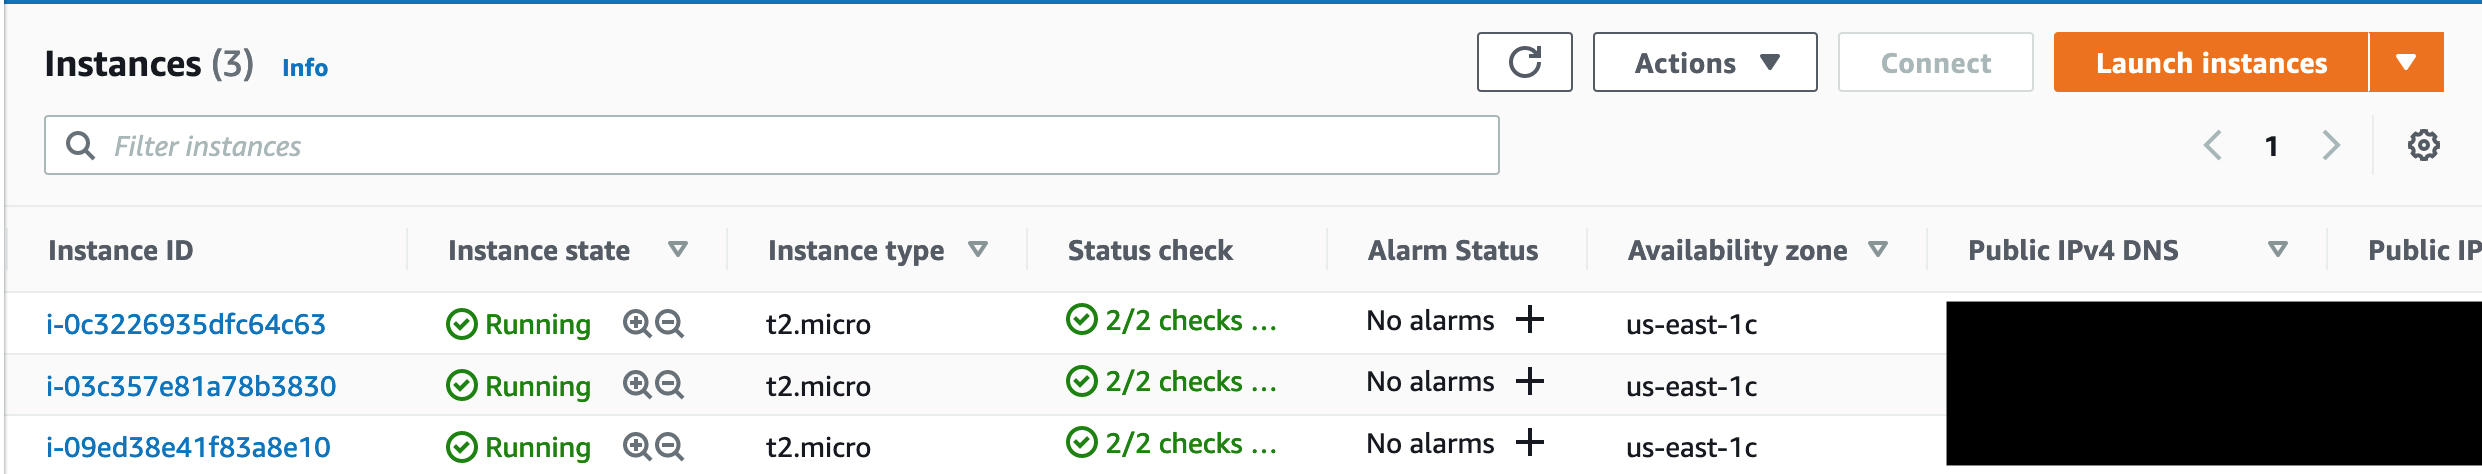
Now that the credentials is set and the launch file is in place, I execute the ec2 run-instances command as follows. After several minutes, 3 EC2 instances should display in the EC2 Dashboard in the AWS EC2 Dashboard.
aws ec2 run-instances --image-id ami-0947d2ba12ee1ff75 --count 2 \
--instance-type t2.micro \
--key-name knatch-devops-challenge \
--security-groups devops-challenge \
--tag-specifications \
'ResourceType=instance,Tags=[{Key=Name,Value=devops-challenge}]' \
--user-data file://launch.sh
--image-id- specifies the ID of the AMI
--instance-type- Amazon EC2 instance type
--key-name- the name of the key pair
--security-groups- the name of the security group, using the one I just created give the instances
--tag-specifications- a tag name for this resources
--user-data- specifies a file used to perform automated configuration tasks
Configuring Prometheus to monitor 2 EC2 instances
As I already have configured 2 EC2 instances via the AWS CLI, I now need to set up dockprom on Instance-0. I can run the same set of commands I have in file launch.sh (but with sudo privilege).
sudo yum update -y
sudo yum install -y docker git
sudo usermod -aG docker ec2-user
sudo curl -L "https://github.com/docker/compose/releases/download/1.27.4/docker-compose-$(uname -s)-$(uname -m)" -o /usr/local/bin/docker-compose
sudo chmod +x /usr/local/bin/docker-compose
sudo ln -s /usr/local/bin/docker-compose /usr/bin/docker-compose

sudo service docker start
docker-compse --version

git clone https://github.com/stefanprodan/dockprom
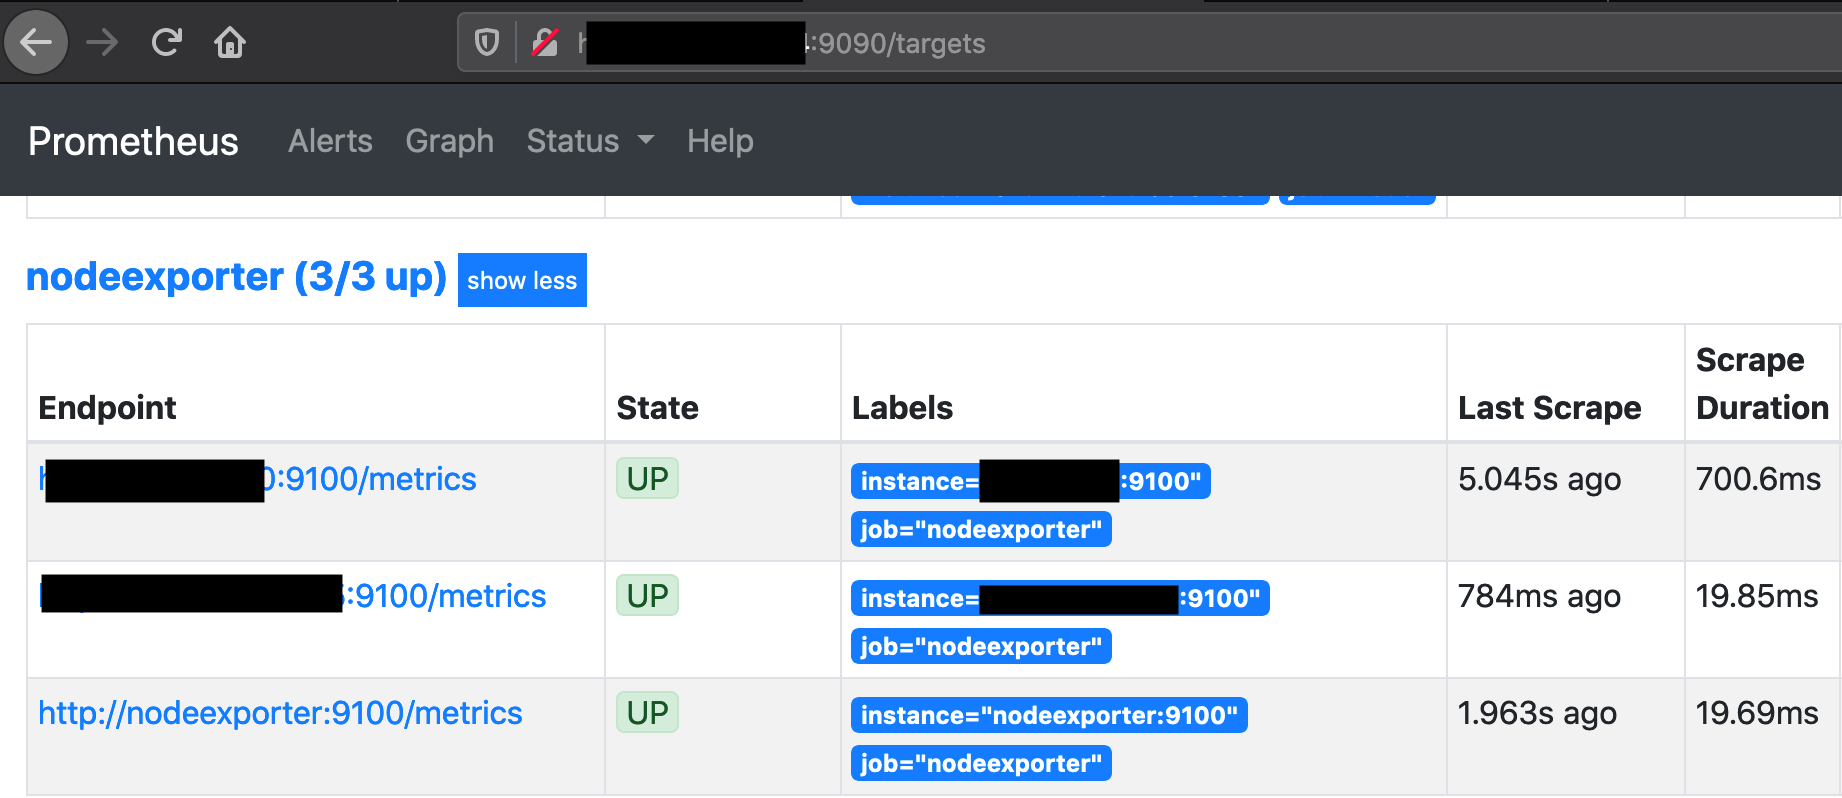
Before running docker-compose up. I need to configure prometheus to scrape the metrics from our target EC2 instances. To achieve this, I add a section in prometheus/prometheus.yml file to target our instances. After that, I can run docker-compose up -d to check the status in Prometheus targets page
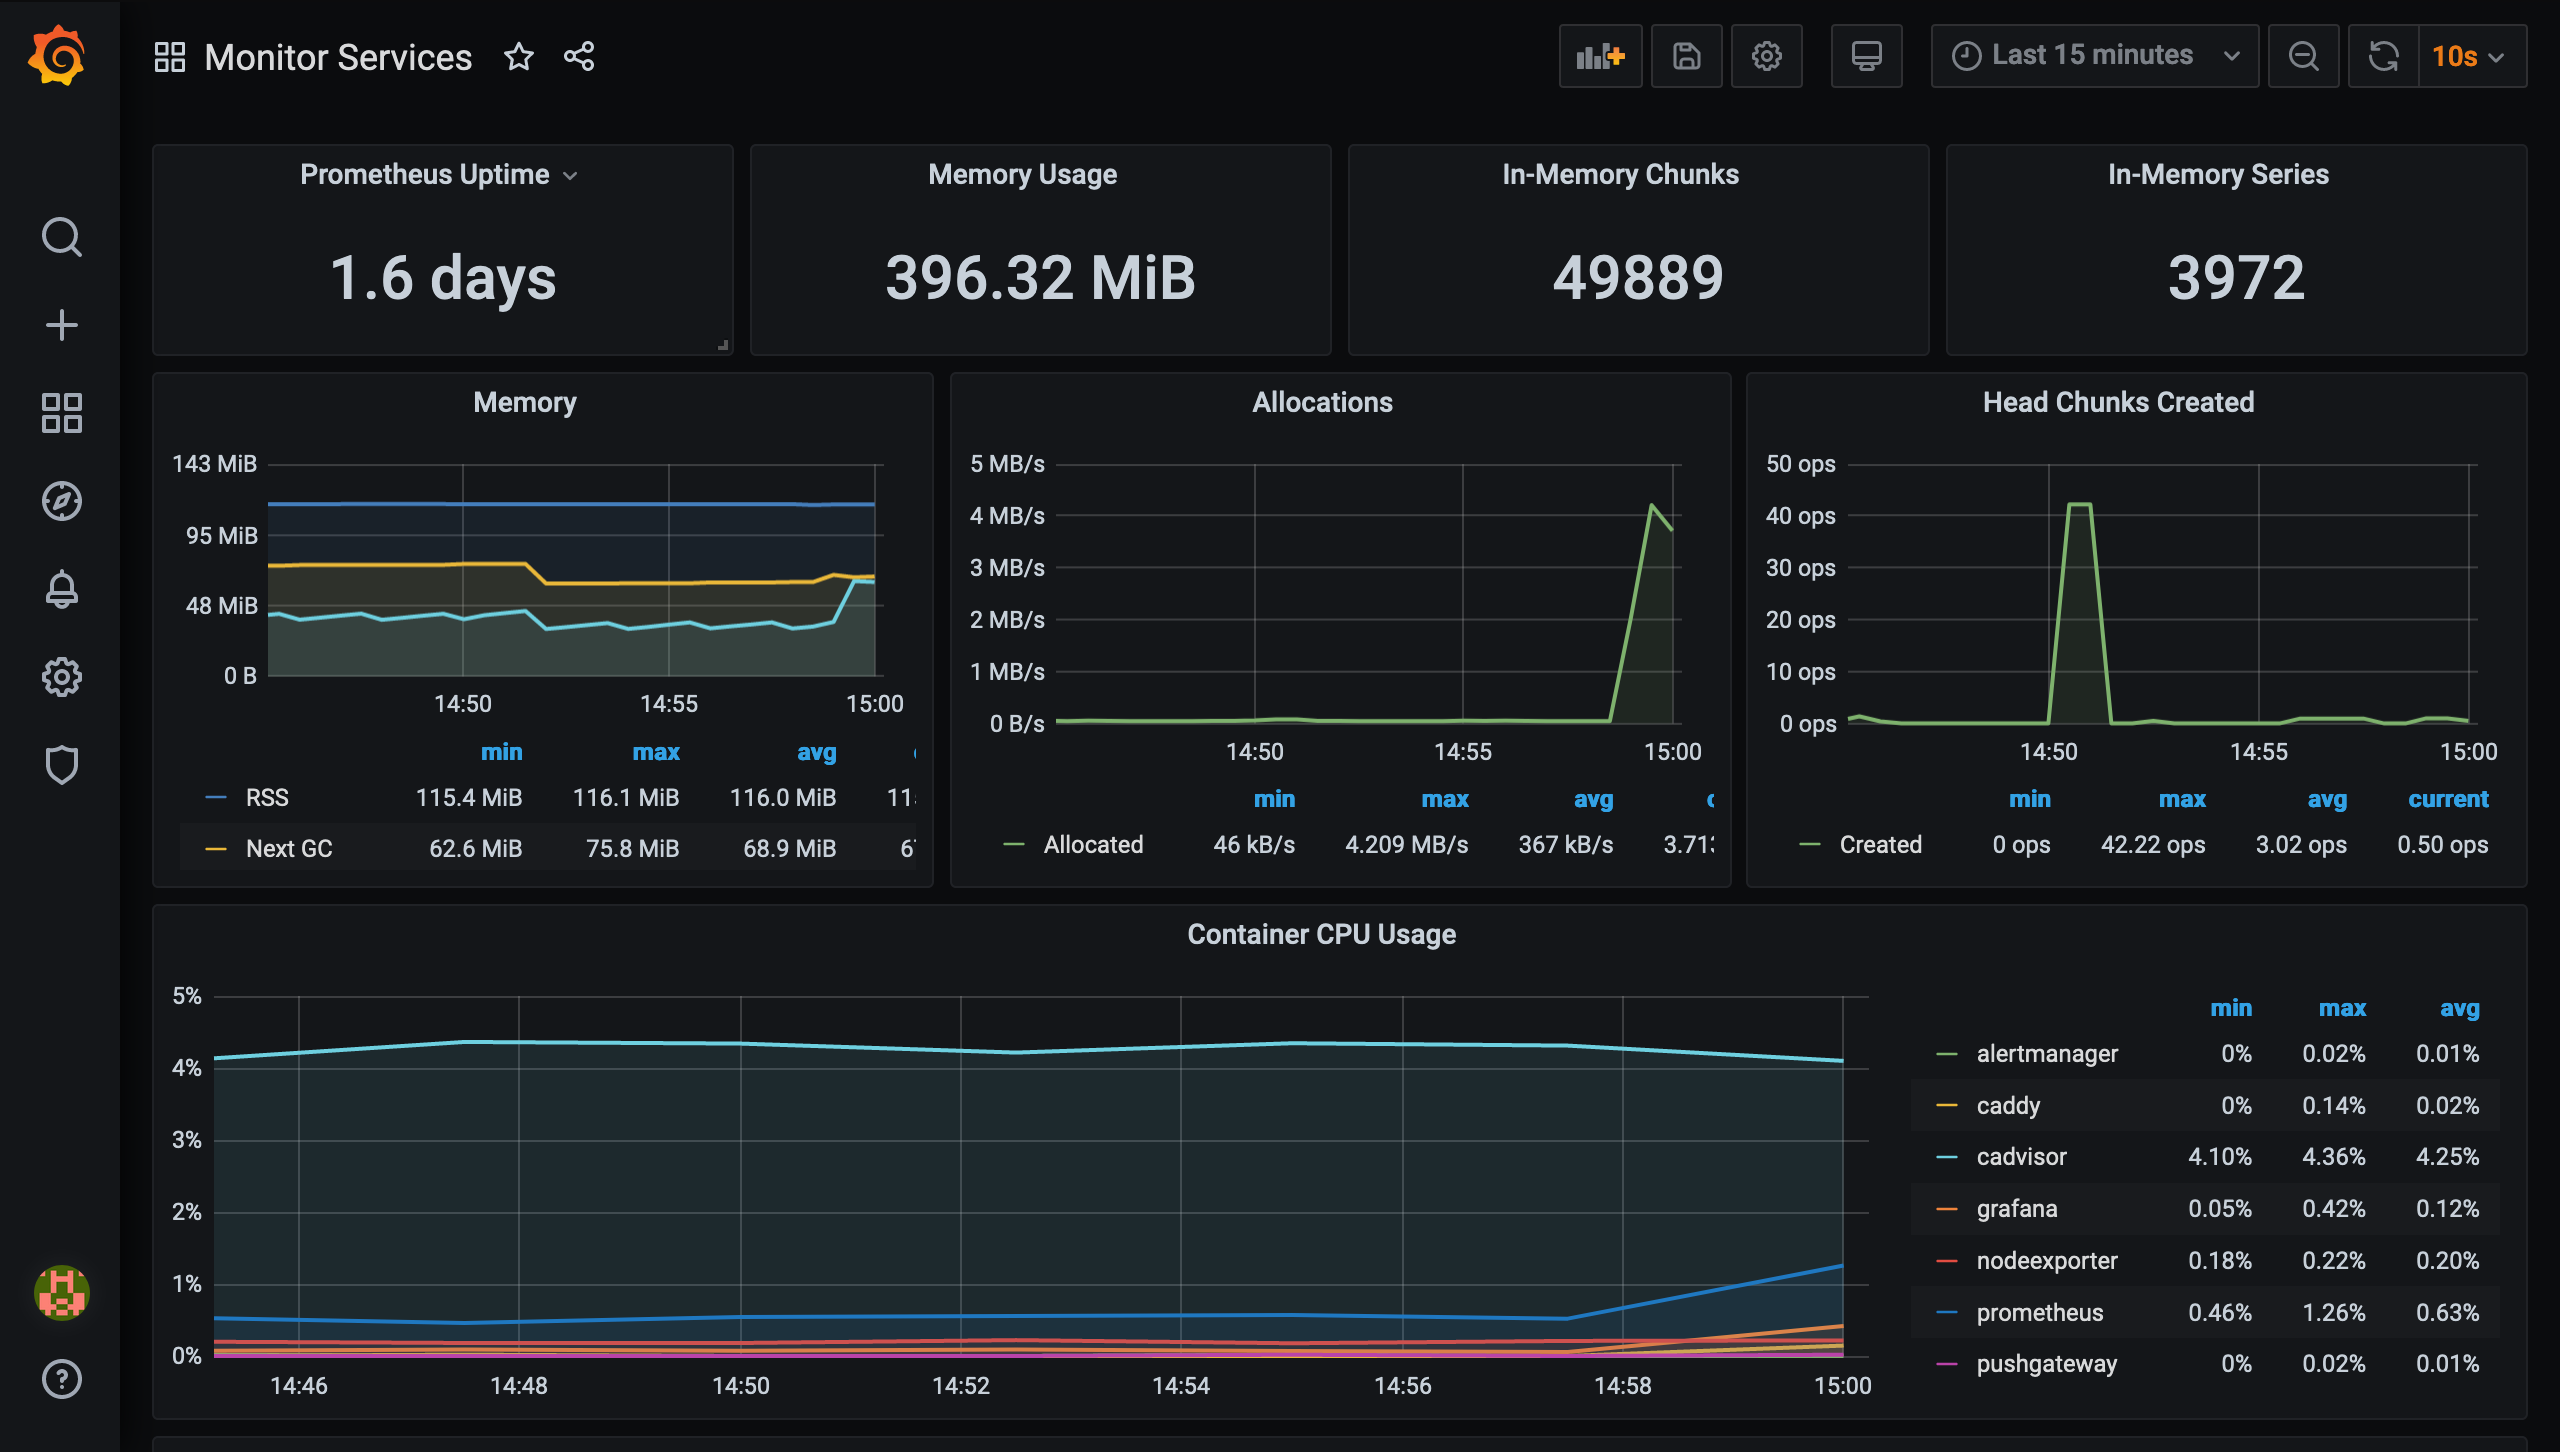
Connecting Prometheus to Grafana
Using dockprom, Grafana Dashboard is directly accessible at port 3000.
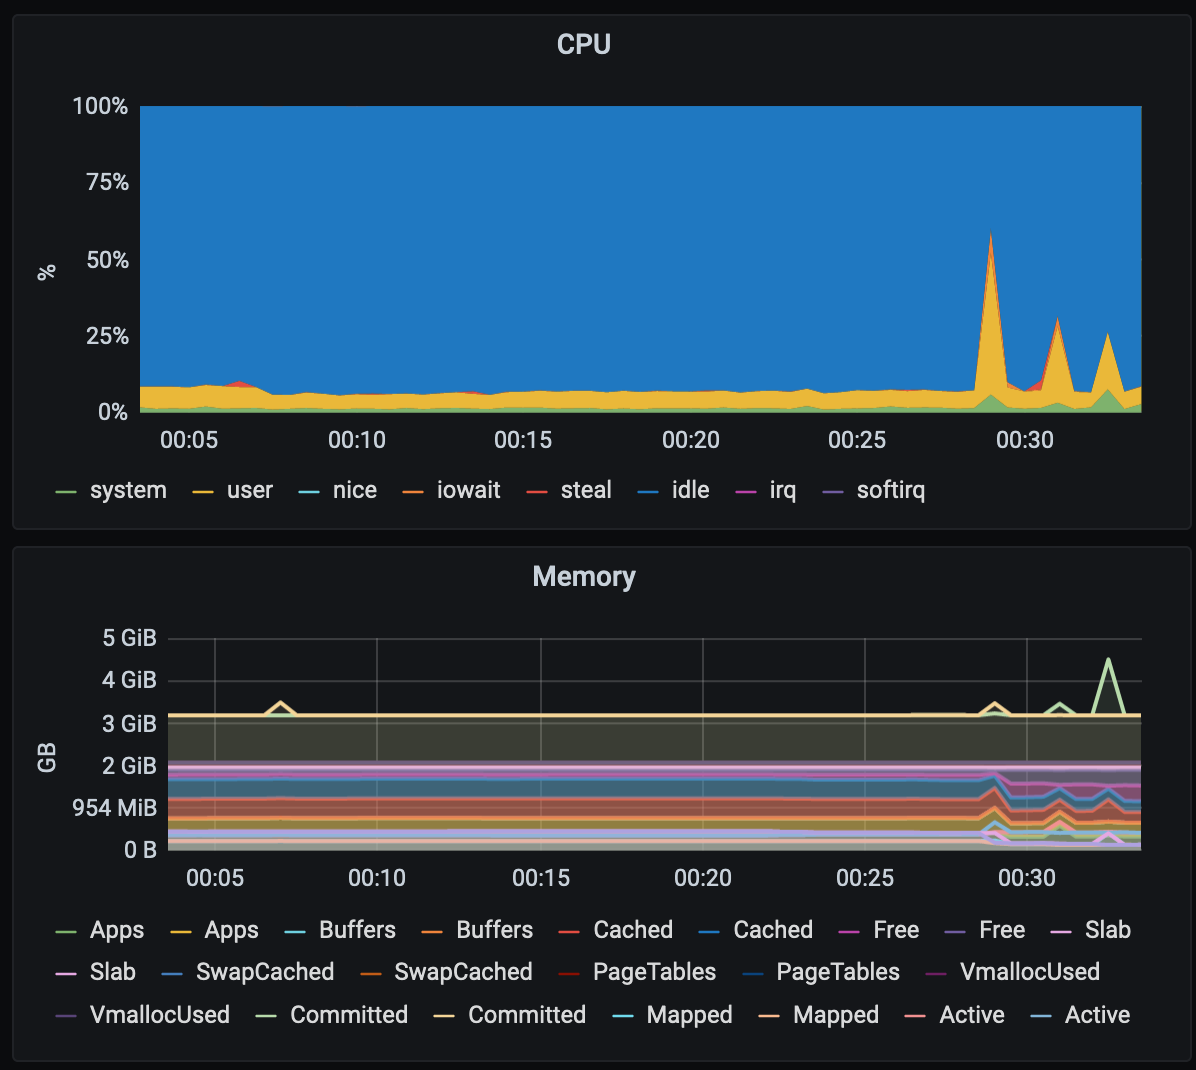
Collecting and displaying CPU, memory and disk space usage
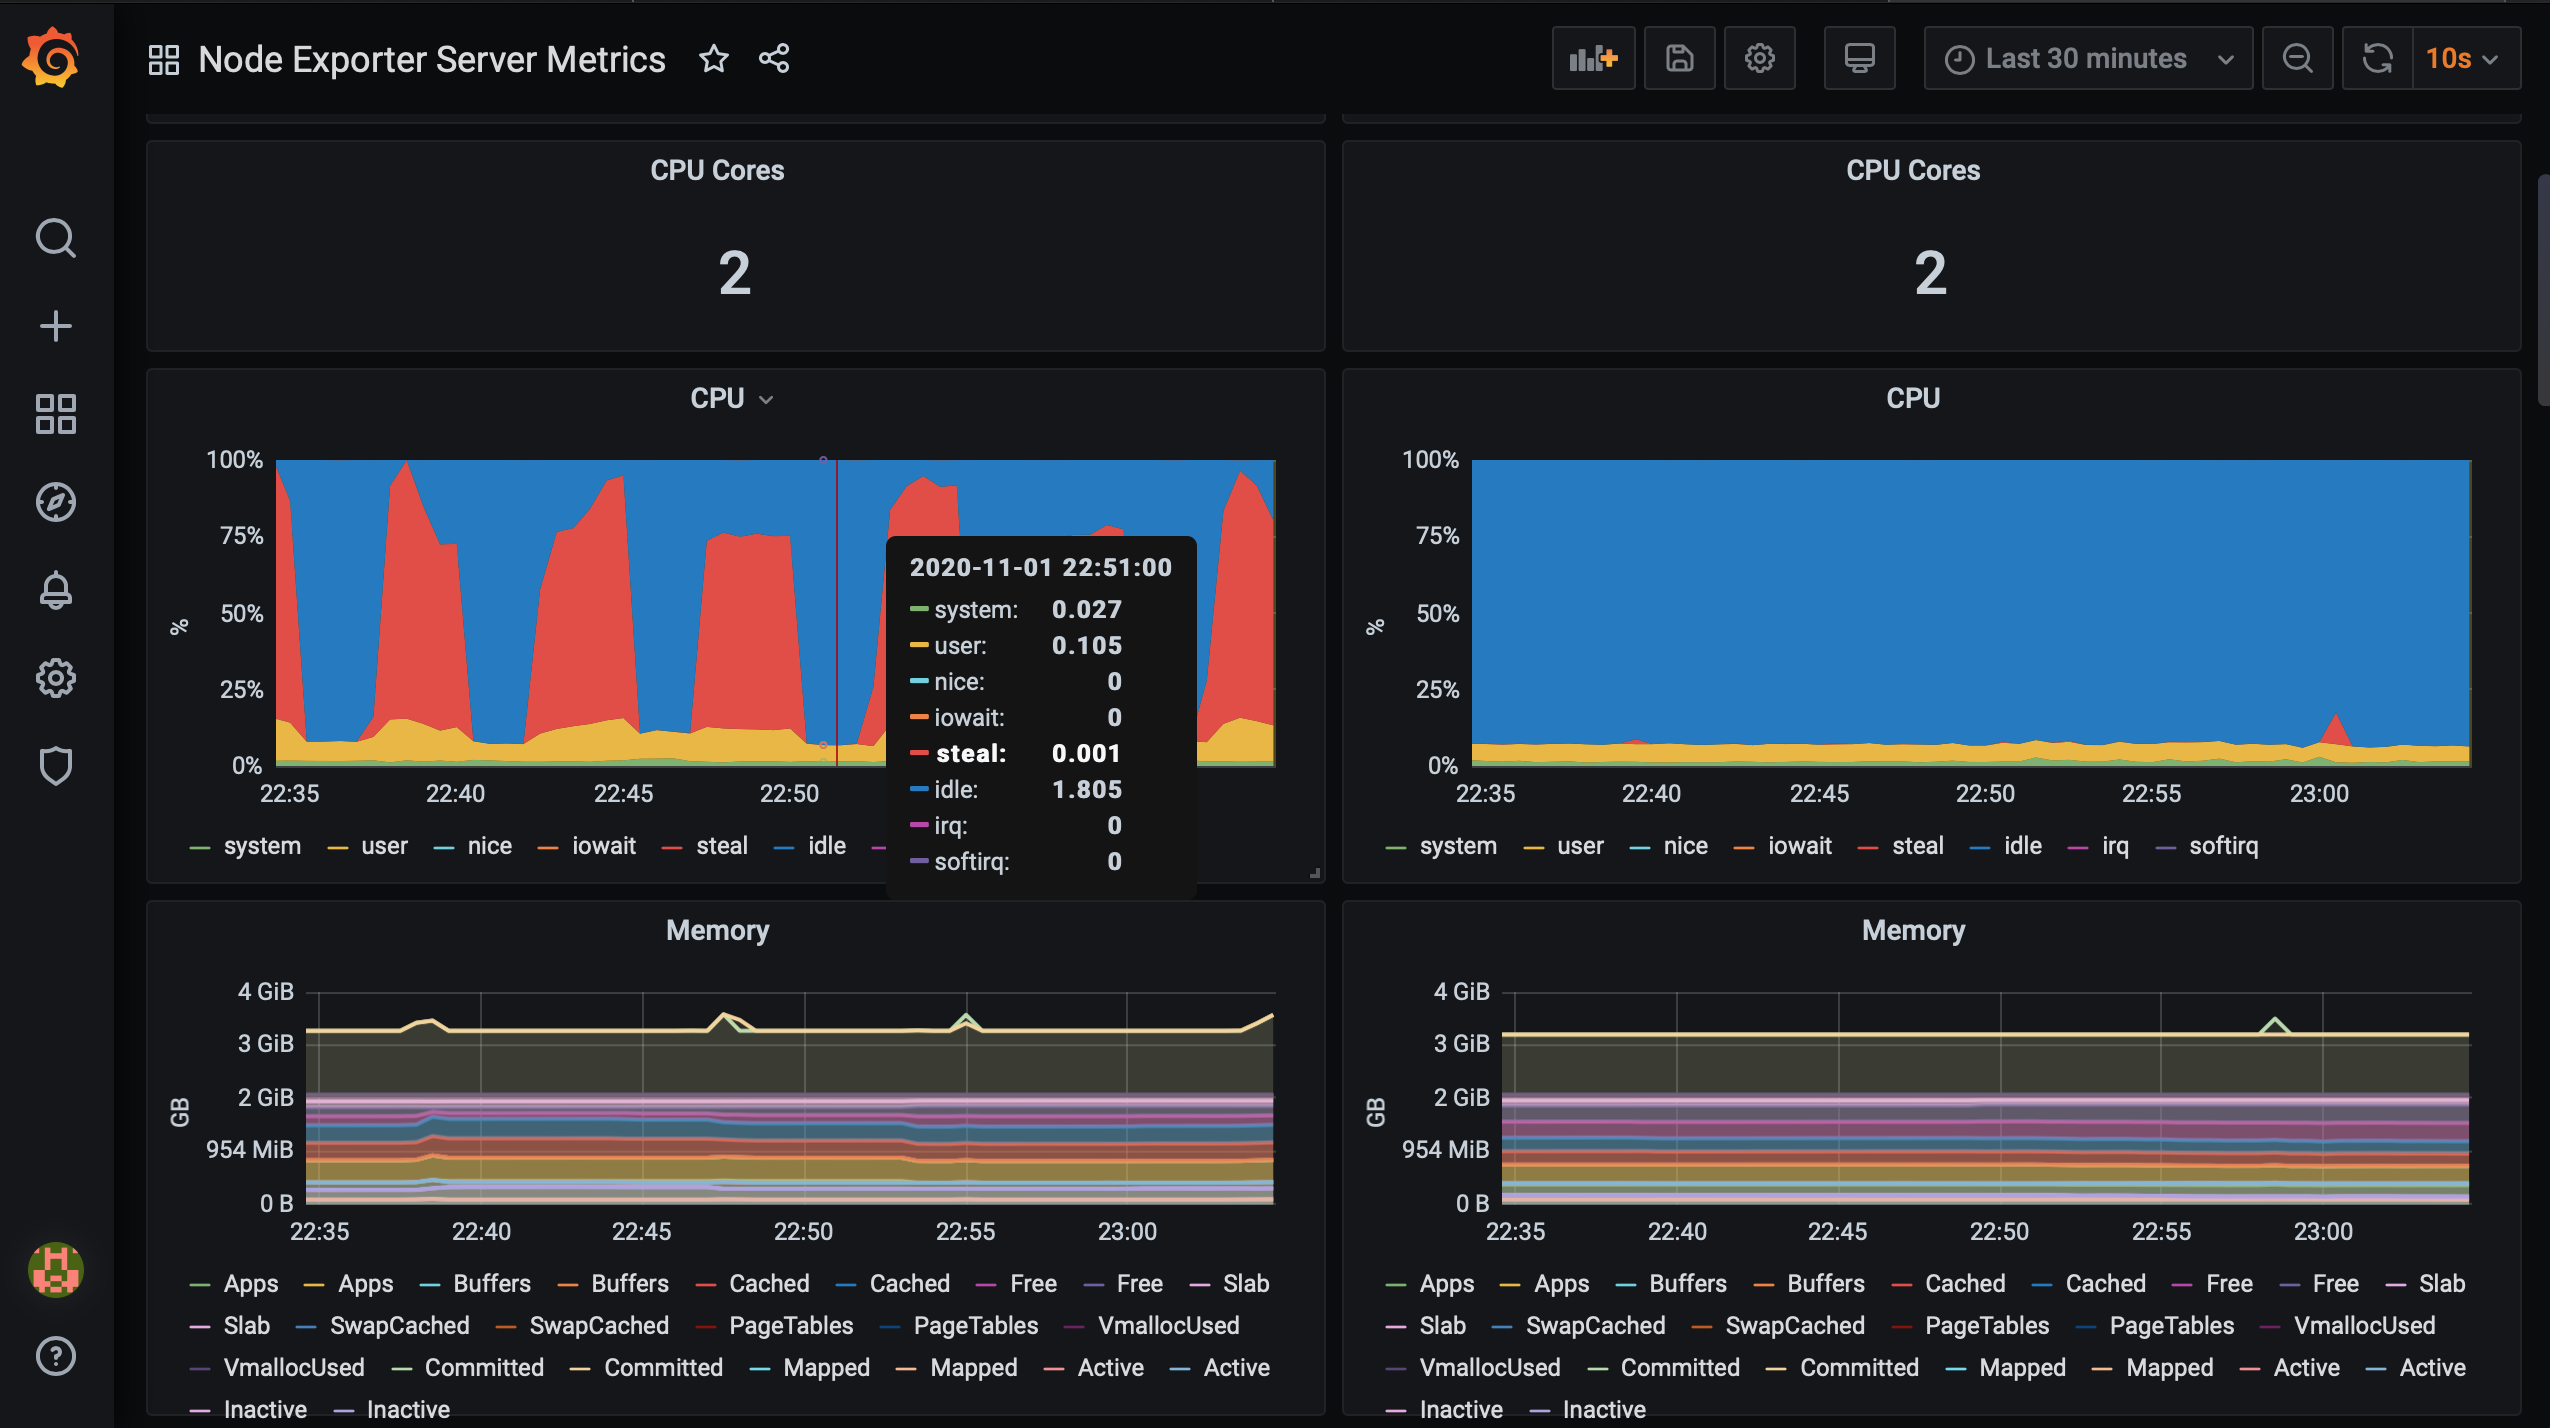
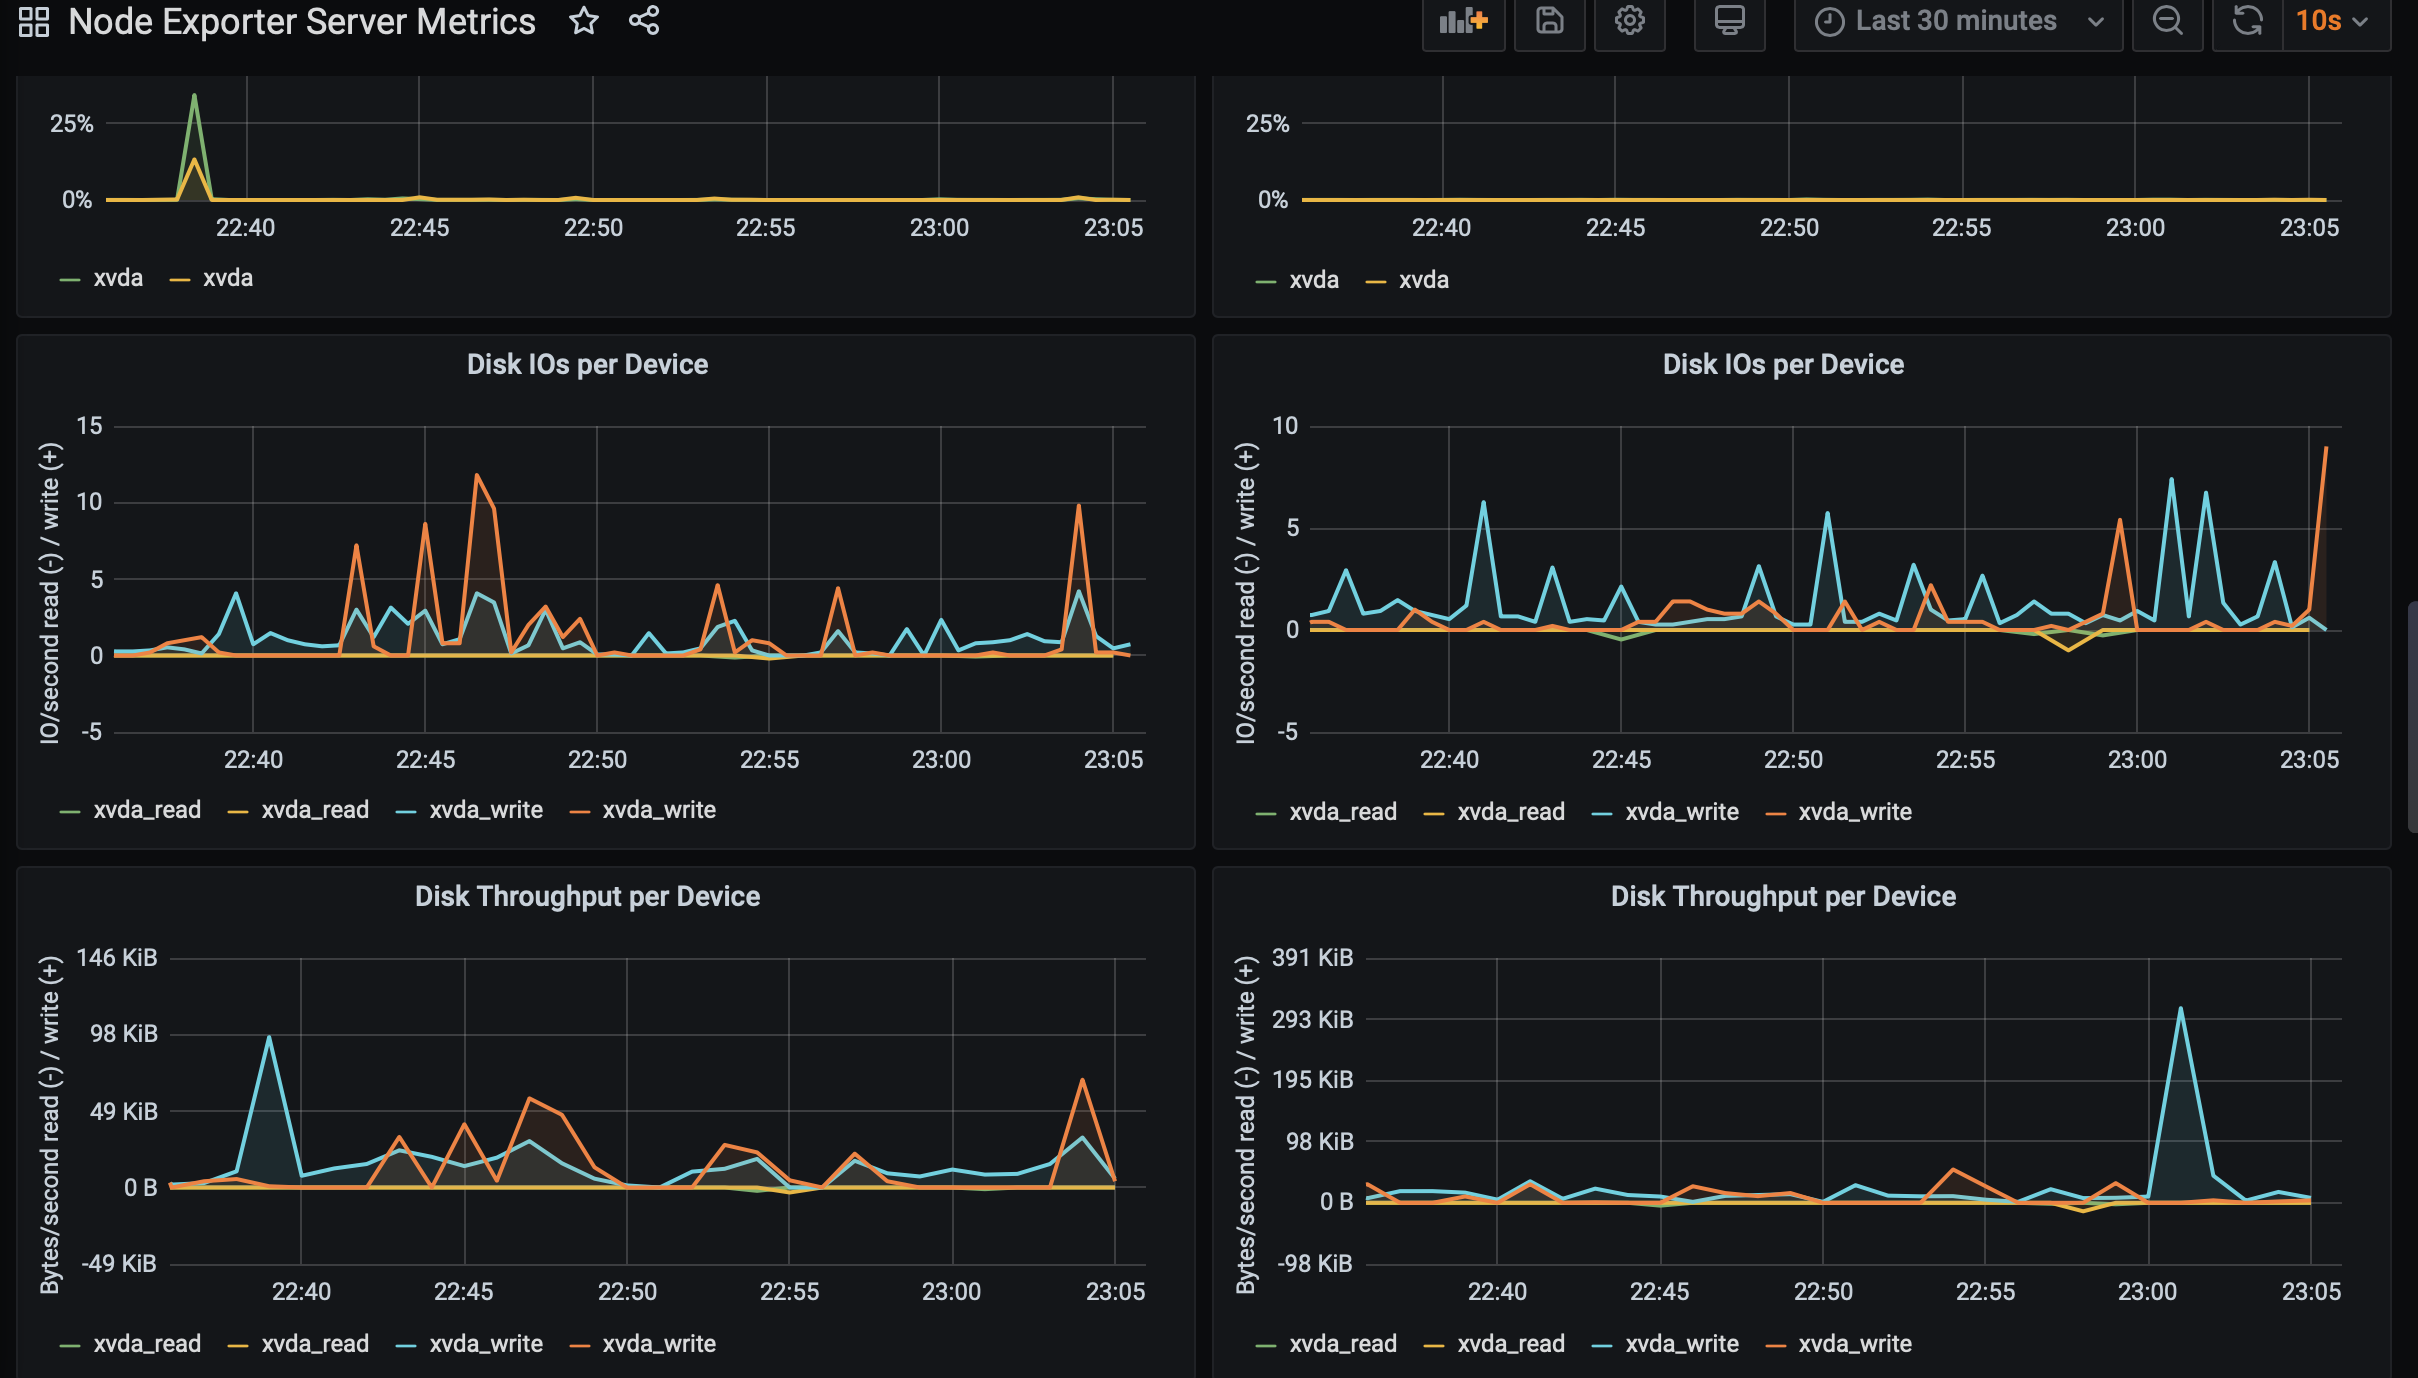
In order to display CPU, memory and disk space metrics from the target sources, I import a Grafana Dashboard for the task. The dashboard is called Node Exporter Server Metric . The left side displays the metrics from Instance-1 while the right Instance-2
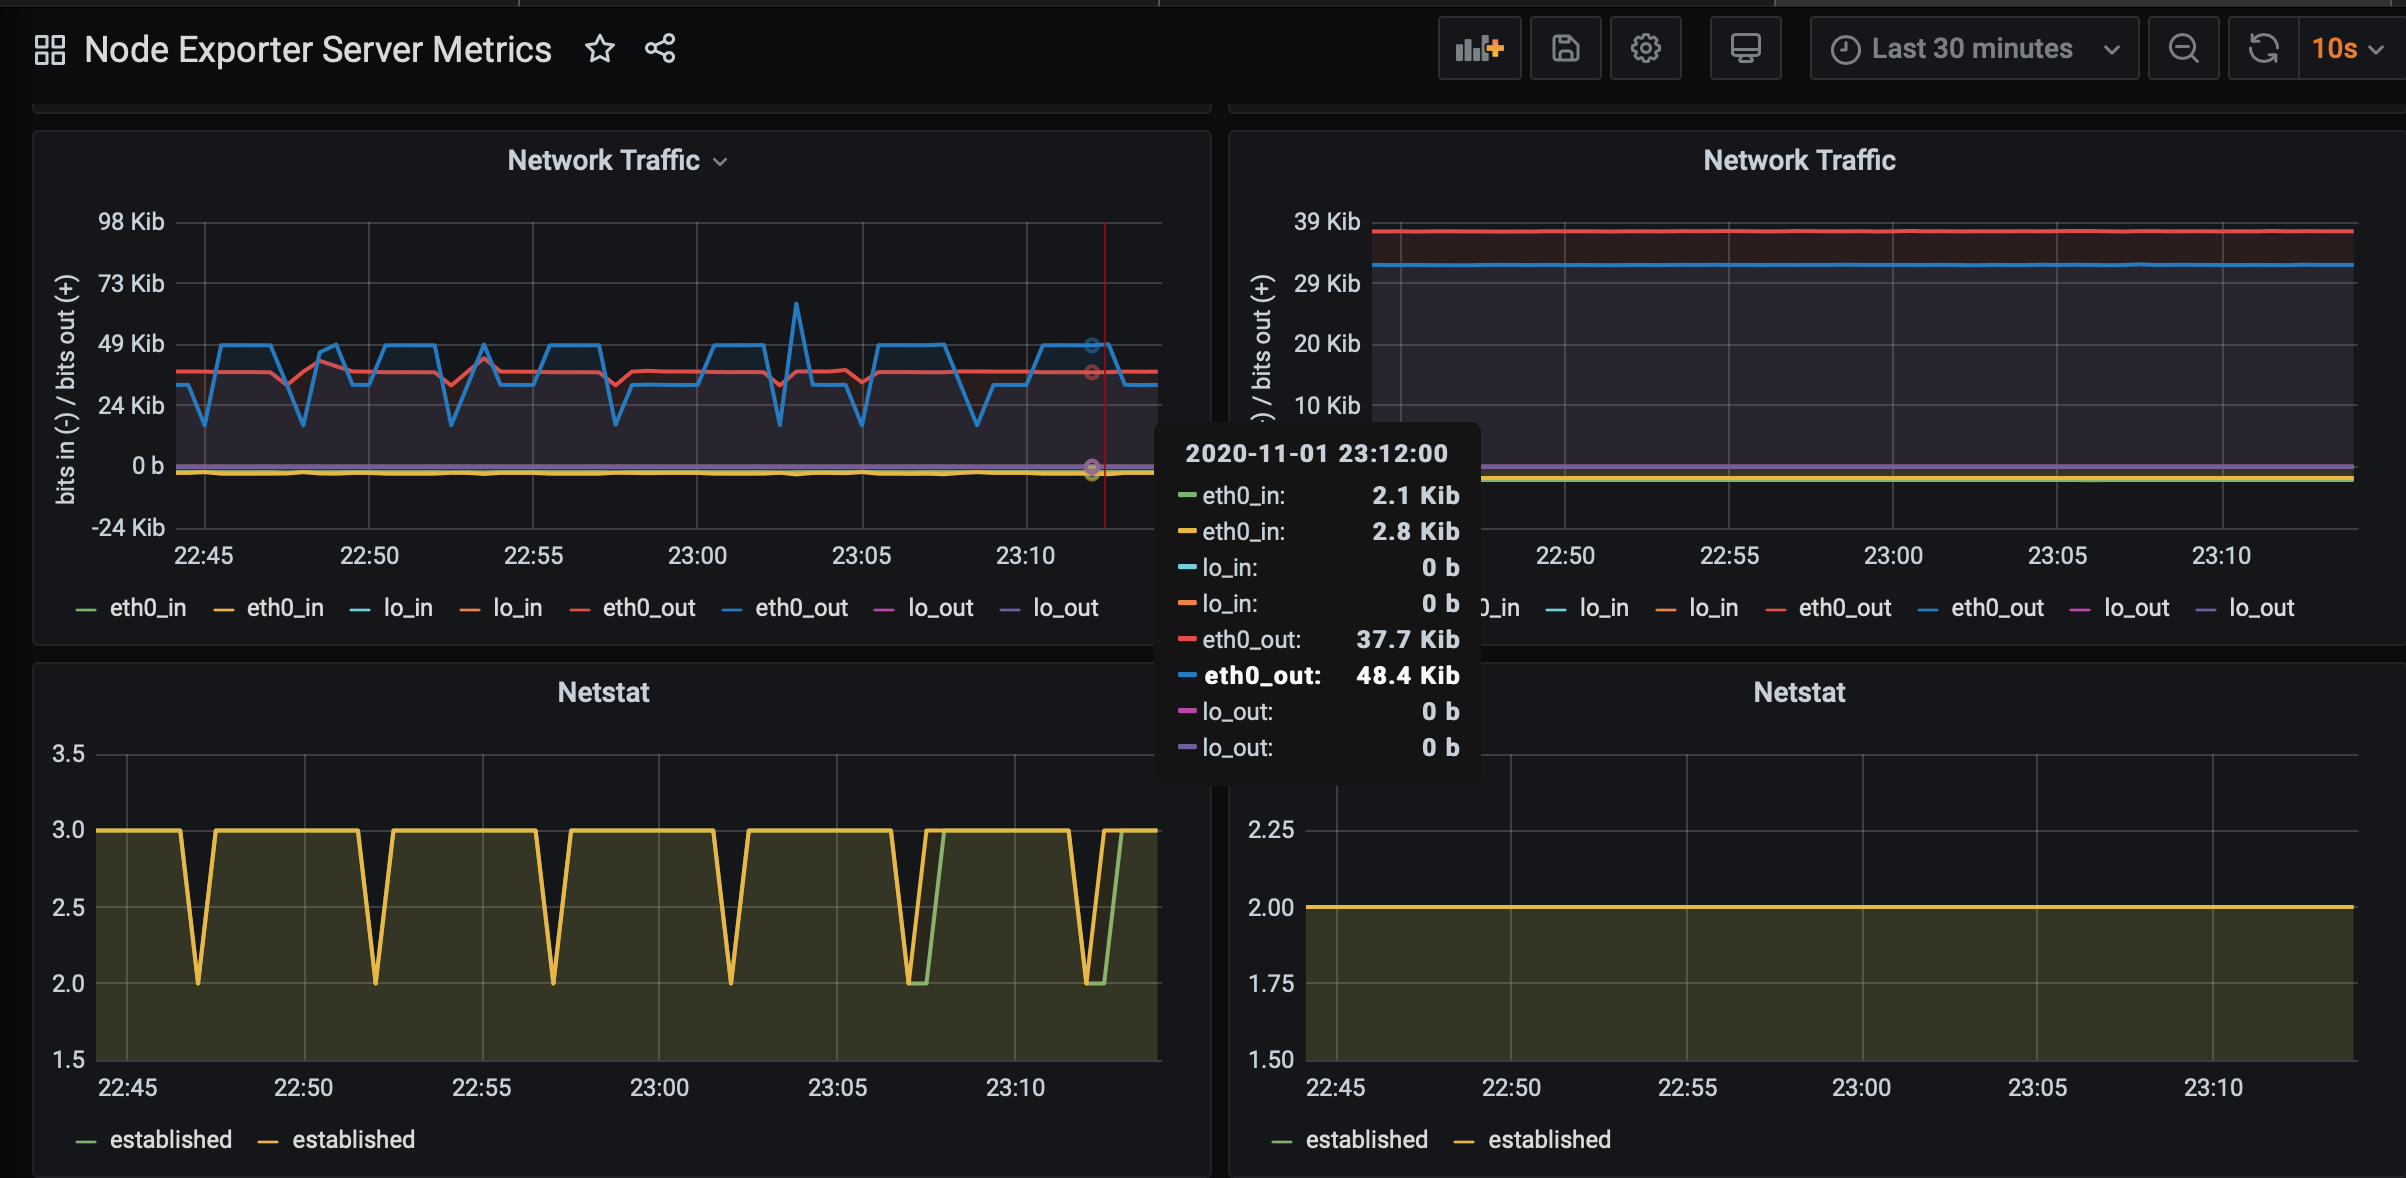
Collecting and displaying network traffic rate, upload rate, and download rate
The same dashboard also provides a network traffic graph.
Simulating high cpu, memory, and disk usage on monitored instances
For this task, I install the stress-ng package to simulate high usage on the monitored instances by running 2 commands on Instance-2. (This could also be done during instance initialization by adding the commands inside launch.sh file and instead of SSHing directly into the instance, we can also issue the command via AWS CLI SSM)
# Enable EPEL
sudo yum install -y https://dl.fedoraproject.org/pub/epel/epel-release-latest-7.noarch.rpm
# install stress-ng
sudo yum install -y stress-ng
With the package installed, I can run the command to stress the CPU usage on the instance
sudo stress-ng --cpu 8 --io 4 --vm 2 --vm-bytes 128M --fork 4 --timeout 10s
Notice the spike in CPU, memory and disk usage on the instance in Grafana Dashboard
Conclusion
That is how I solve the challenge. I know a superb engineer friend of mine who would have elected to resolve this task with ansible as an alternative for AWS CLI. As already stated above, there are numerous ways to complete the challenge. Should you read it all the way down here and have any comments/recommendations on how I can improve the process, kindly let me know.